Monitoring device health: Insights sessions
Tip: This feature is available on request with a free-tier account and by default with a commercial account. See Choosing your account type for more information about the other benefits of commercial accounts and how to upgrade a free account to a commercial account.
Monitoring device operational data lets you identify, analyze and address security and operational incidents quickly when they arise.
Izuma Device Sentry is a service you can use to define metrics and collect operational data, or insights, from your deployed devices at set time intervals. Device Sentry can monitor data such as CPU usage, incoming and outgoing IP network traffic and the number of threads executing concurrently on a device.
The collected data and reported incidents can provide you with insights about the state of deployed devices; for example, longer than usual device uptime, unusual battery consumption and possible bugs or security threats, such as malware or attacks. Although device performance information is important at all times, device insights may be especially critical in monitoring and following up on events such as a firmware update or suspected cyber attack.
To monitor a group of devices, you define an insights session for which you configure a set of metrics to monitor and threshold values for these metrics.
When a device reports data that exceeds one of the thresholds you set, Device Sentry creates an incident.
Note: The Device Sentry feature is currently not enabled by default. If you would like to use Device Sentry, please contact us.
Collecting device insights using Device Sentry
To monitor a set of parameters for a group of devices:
-
Enable the Device Sentry feature on your device application.
-
Set up a device insights session, link it to your device group and configure the parameters you want to monitor, including threshold values, monitoring interval and incident message descriptions.
-
Device Management creates incidents when a device in your device group breaches any of the metric threshold values you define.
Enabling Device Sentry on your device application
Device Management Client 4.5.0 and later supports the Device Sentry feature on Mbed OS and Linux devices.
Mbed OS
Device Management Client example supports the Device Sentry feature by default on FRDM-K66F devices.
To use a different device, make the following updates to the mbed_app.json file before you compile the code:
-
To enable Device Sentry, add:
"mbed-cloud-client.enable-device-sentry": 1 -
To allow the device application to collect and report network usage statistics (optional), add:
"nsapi.socket-stats-enabled" : 1 -
To allow the device application to collect and report CPU statistics (optional), add:
"platform.cpu-stats-enabled" : 1
Linux OS
To use Device Sentry with a Linux board, compile the Device Management Client example with the -DENABLE_DEVICE_SENTRY=ON cmake flag.
Setting up a device insights session
You include devices in an insights session by adding them to a device group and associating the group to the session.
Therefore, before setting up a device insights session, create a device group and add devices to the group.
Note: When you modify a device group associated with an insights session, Device Management does not automatically update the list of devices that participate in the insights session. To modify the list of devices you monitor, create a new insights session.
To set up a device insights session in Device Management Portal:
-
Select Device directory > Insights sessions from the side menu.
-
Click Create session.
-
Populate the Name and Description fields.
-
Add a group from the Device group list.
-
In the Parameters section:
-
Click Add new to select the metrics that devices report - Thread count, CPU usage, Network usage or Memory usage.
You can add multiple metrics.
-
For each metric, configure:
- Interval - The interval at which devices report the metric.
- Threshold - When a device reports a value that exceeds the threshold value, Device Sentry reports an incident.
- Allowed TCP destination (for Network usage only) - A whitelist of IP addresses and, optionally, ports that devices are allowed to communicate with.
- Message - A description of the insight; for example, High network traffic. The message is included in the incident report.
-
-
Set an interval, threshold and message for each parameter you add.
Note: If you define different intervals for different parameters, Device Sentry applies the shortest interval to all parameters. For example, if you define a 30-second interval for Thread count and a 60-second interval for Network usage, Device Sentry monitors both thread count and network usage at 30-second intervals.
-
Click Save.
The monitoring session is now active.
Viewing device insights and incidents
To view incident data in Device Management Portal:
-
Select Device directory > Insights sessions from the side menu.
This opens the Insights sessions window, which lists the defined insights sessions.
-
Click the link to an insights session.
This opens the Insight session details pane on the right side.
-
Select a tab on the Insight session details pane to view details:
- Summary - Insights session details, including metrics configuration.
- Devices - Device group ID and list of devices.
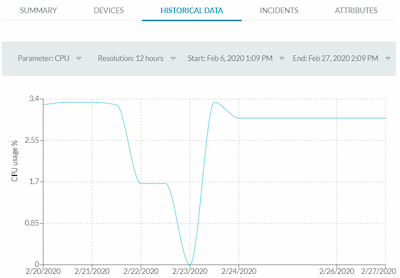
- Historical data - Configurable graphs of device metric history.
- Incidents - List of incidents.
- Attributes - The raw configuration of the insights session.
Note: You can view insights session data for up to 15 days.